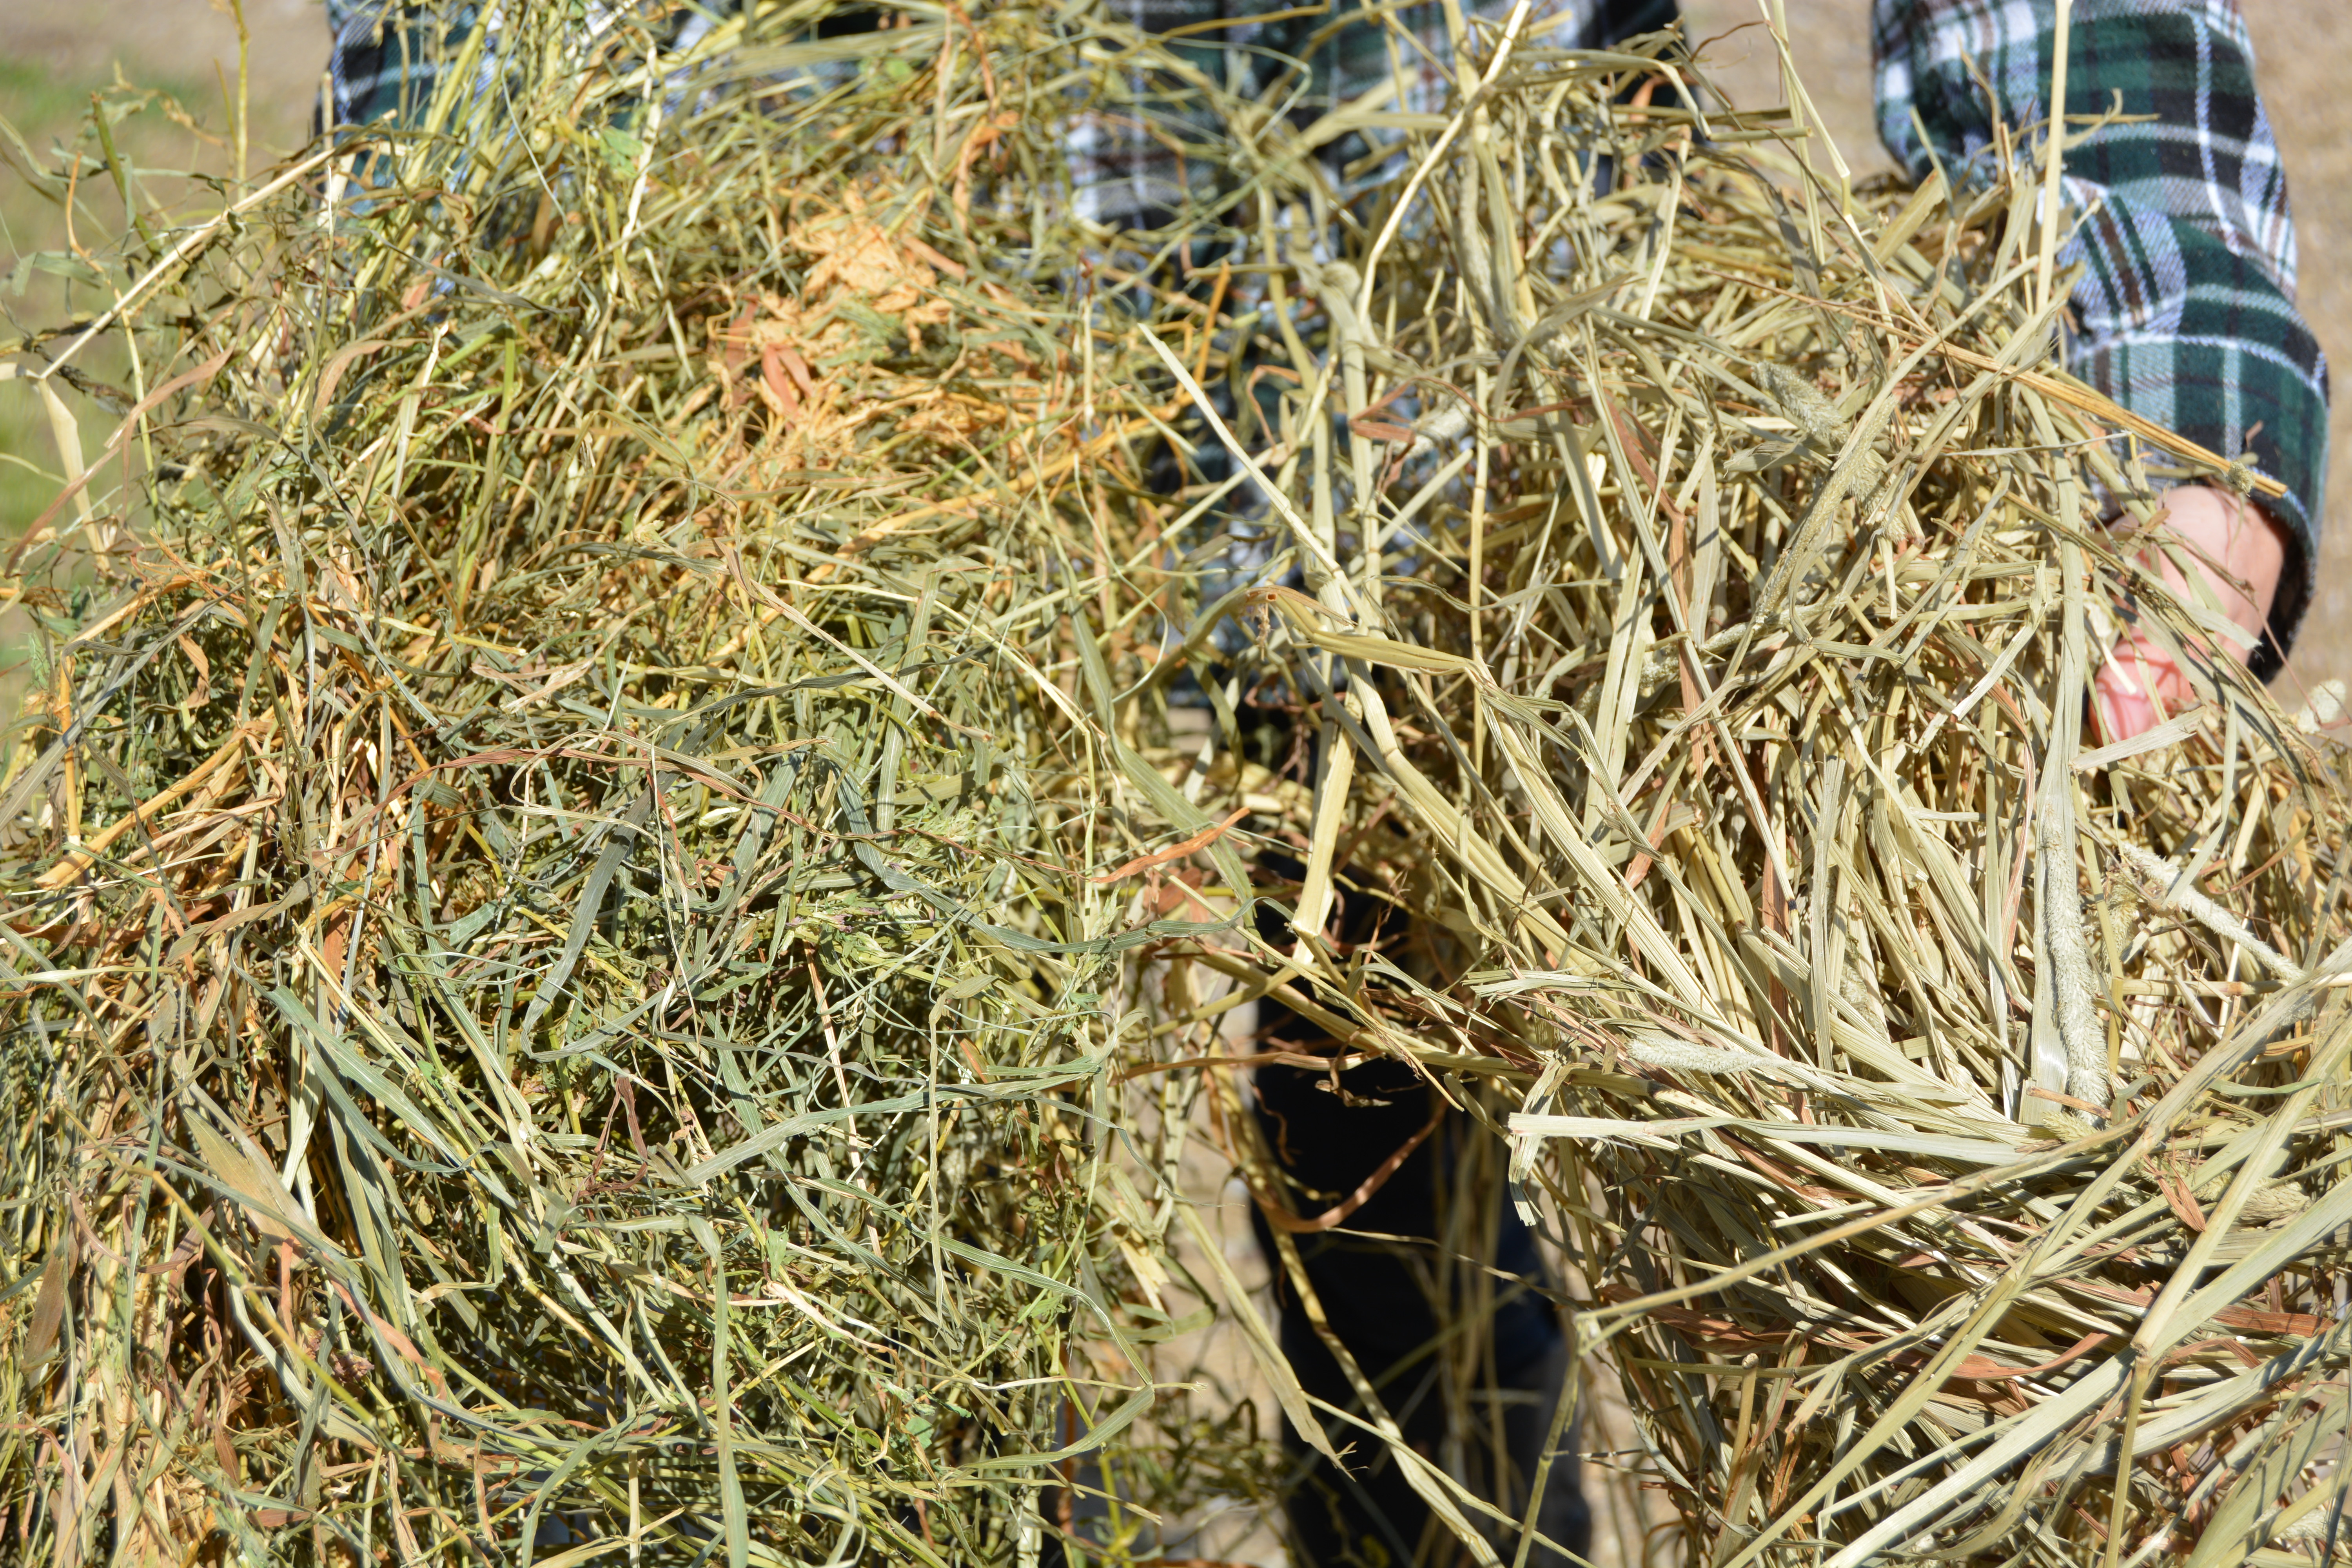
A source of fiber in large animal diets, hay also provides energy and protein that varies in quantity based on the ratio of legumes to grass in the hay. The stem of the plants that make up hay provides the main fiber source (cell wall of stem) and the leaves and seeds provide the most nutrients (energy and protein). Grass hay (on right) is taller and has more stem than leaves, and consists of plants like timothy, orchard, and brome. Legume hay (on left) is shorter and has more leaves and seeds than stem, and consists of plants like alfalfa and clover. This makes legume hay more nutrient dense. Hay is harvested and stored dry.
Analysis of nutrient content of different types of hay:
|
Legume Hay – 1st cut |
|||
|
Measure |
Mean |
Margin of Error (St. Dev x2) |
Range (+/- St. Dev) |
|
Moisture, % |
11.29 |
6.42 |
8.08 – 14.50 |
|
CP, % |
16.44 |
6.96 |
12.96 – 19.92 |
|
ADF, % |
36.46 |
10.54 |
31.19 – 41.73 |
|
NDF, % |
48.12 |
15.14 |
40.55 – 55.69 |
|
Calcium, % |
1.10 |
0.70 |
0.75 – 1.45 |
|
Phosphorus, % |
0.27 |
0.10 |
0.22 – 0.32 |
|
Magnesium, % |
0.25 |
0.18 |
0.16 – 0.34 |
|
Potassium, % |
2.06 |
0.92 |
1.60 – 2.52 |
|
Starch, % |
0.78 |
0.84 |
0.36 – 1.20 |
|
Energy |
Approximately 2.81 Mcal/kg Digestible Energy |
||
|
Grass Hay – 1st Cut |
|||
|
Measure |
Mean |
Margin of Error (St. Dev x2) |
Range (+/- St. Dev) |
|
Moisture, % |
11.40 |
14.40 |
4.20 – 18.60 |
|
CP, % |
14.92 |
10.52 |
9.66 – 20.18 |
|
ADF, % |
32.60 |
15.30 |
24.95 – 40.25 |
|
NDF, % |
51.72 |
15.50 |
43.97 – 59.47 |
|
Calcium, % |
0.54 |
0.58 |
0.25 – 0.83 |
|
Phosphorus, % |
0.31 |
0.16 |
0.23 – 0.39 |
|
Magnesium, % |
0.15 |
0.12 |
0.09 – 0.21 |
|
Potassium, % |
2.72 |
1.46 |
1.99 – 3.45 |
|
Starch, % |
2.38 |
1.32 |
1.72 – 3.04 |
|
Energy |
Approximately 2.84 Mcal/kg Digestible Energy |
||
|
Mixed Hay – 1st cut |
|||
|
Measure |
Mean |
Margin of Error (St. Dev x2) |
Range (+/- St. Dev) |
|
Moisture, % |
10.93 |
13.54 |
4.16 – 17.70 |
|
CP, % |
13.53 |
6.80 |
10.13 – 16.93 |
|
ADF, % |
39.13 |
9.86 |
34.20 – 44.06 |
|
NDF, % |
55.39 |
12.98 |
48.90 – 61.88 |
|
Calcium, % |
0.74 |
0.60 |
0.44 – 1.04 |
|
Phosphorus, % |
0.25 |
0.12 |
0.19 – 0.31 |
|
Magnesium, % |
0.18 |
0.12 |
0.12 – 0.24 |
|
Potassium, % |
2.11 |
1.14 |
1.54 – 2.68 |
|
Starch, % |
1.73 |
1.20 |
1.13 – 2.33 |
|
Energy |
Approximately 2.86 Mcal/kg Digestible Energy |
||
|
Hay – 2nd cut |
|||
|
Measure |
Mean |
Margin of Error (St. Dev x2) |
Range (+/- St. Dev) |
|
Moisture, % |
11.27 |
7.34 |
7.60 – 14.94 |
|
CP, % |
17.35 |
5.42 |
14.64 – 20.06 |
|
ADF, % |
36.38 |
10.85 |
30.95 – 41.81 |
|
NDF, % |
48.62 |
11.86 |
42.69 – 54.55 |
|
Calcium, % |
1.10 |
0.50 |
0.85 – 1.35 |
|
Phosphorus, % |
0.30 |
0.10 |
0.25 – 0.35 |
|
Magnesium, % |
0.25 |
0.12 |
0.19 – 0.31 |
|
Potassium, % |
2.44 |
1.16 |
1.86 – 3.02 |
|
Starch, % |
1.32 |
1.20 |
0.72 – 1.92 |
|
Energy |
Approximately 2.50 Mcal/kg Digestible Energy |
||
References:
Agrifood Labs Forage Summary 2013
Agrifood Labs Forage Summary 2014
Nutrition and Management, Alberta Department of Agriculture and Forestry
Nutrient Composition of Feeds, University of Madison Wisconsin